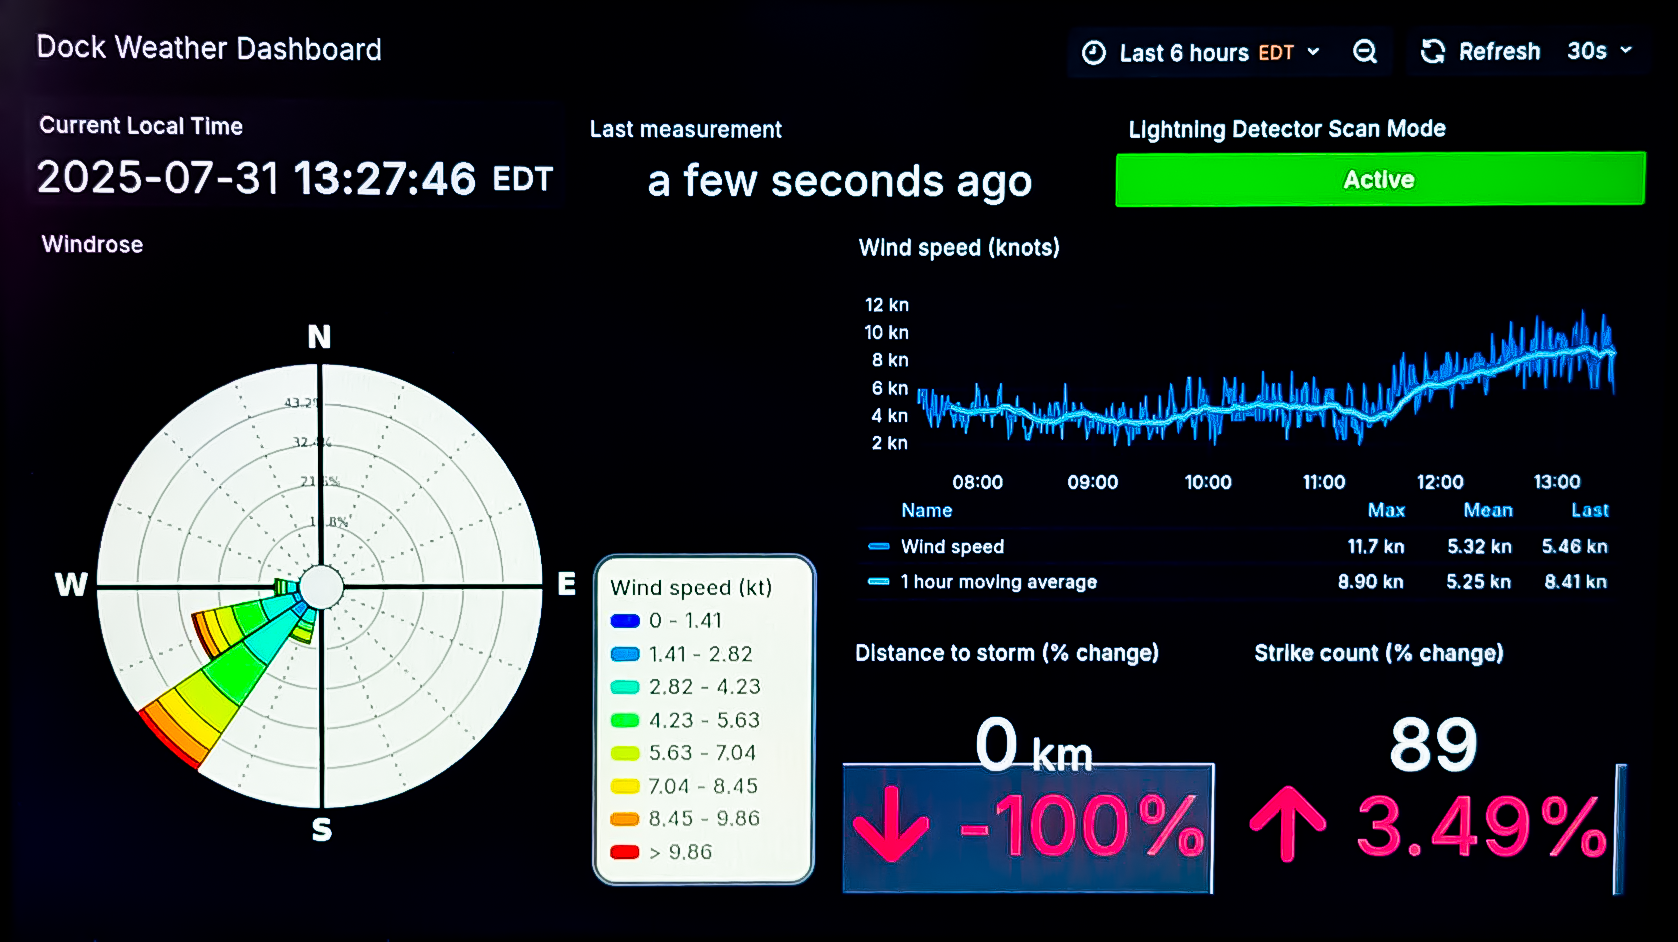
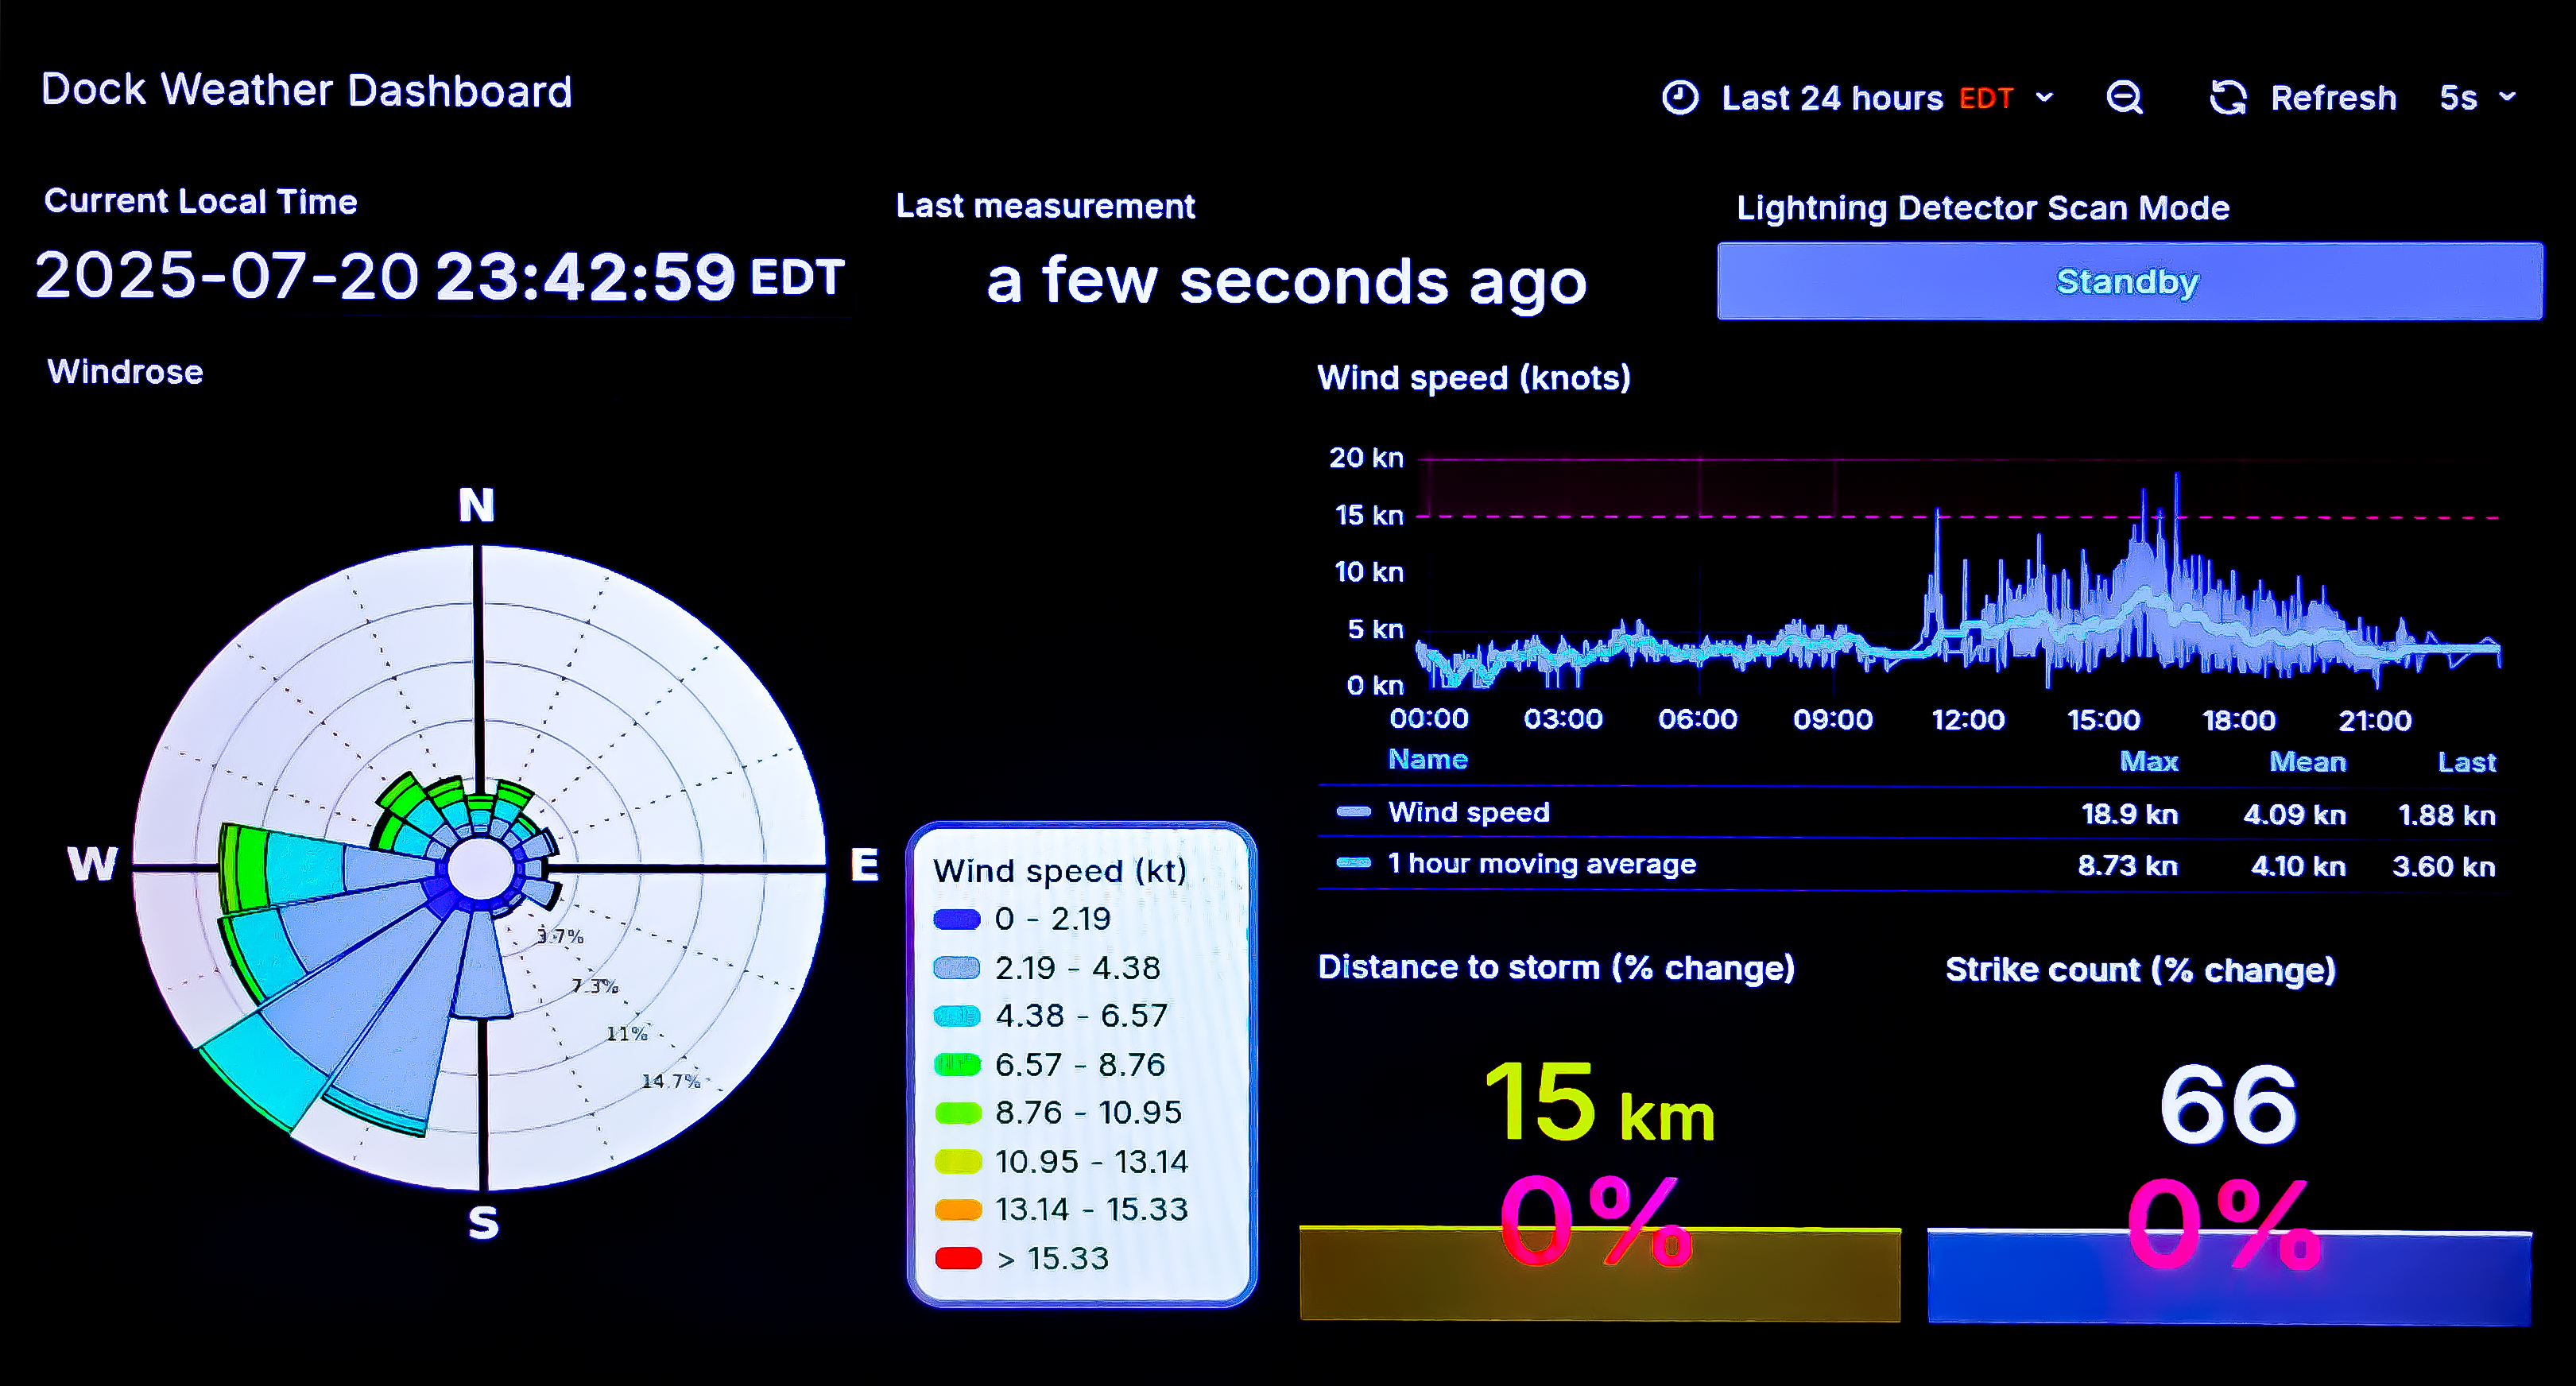
Dock Weather Dashboard
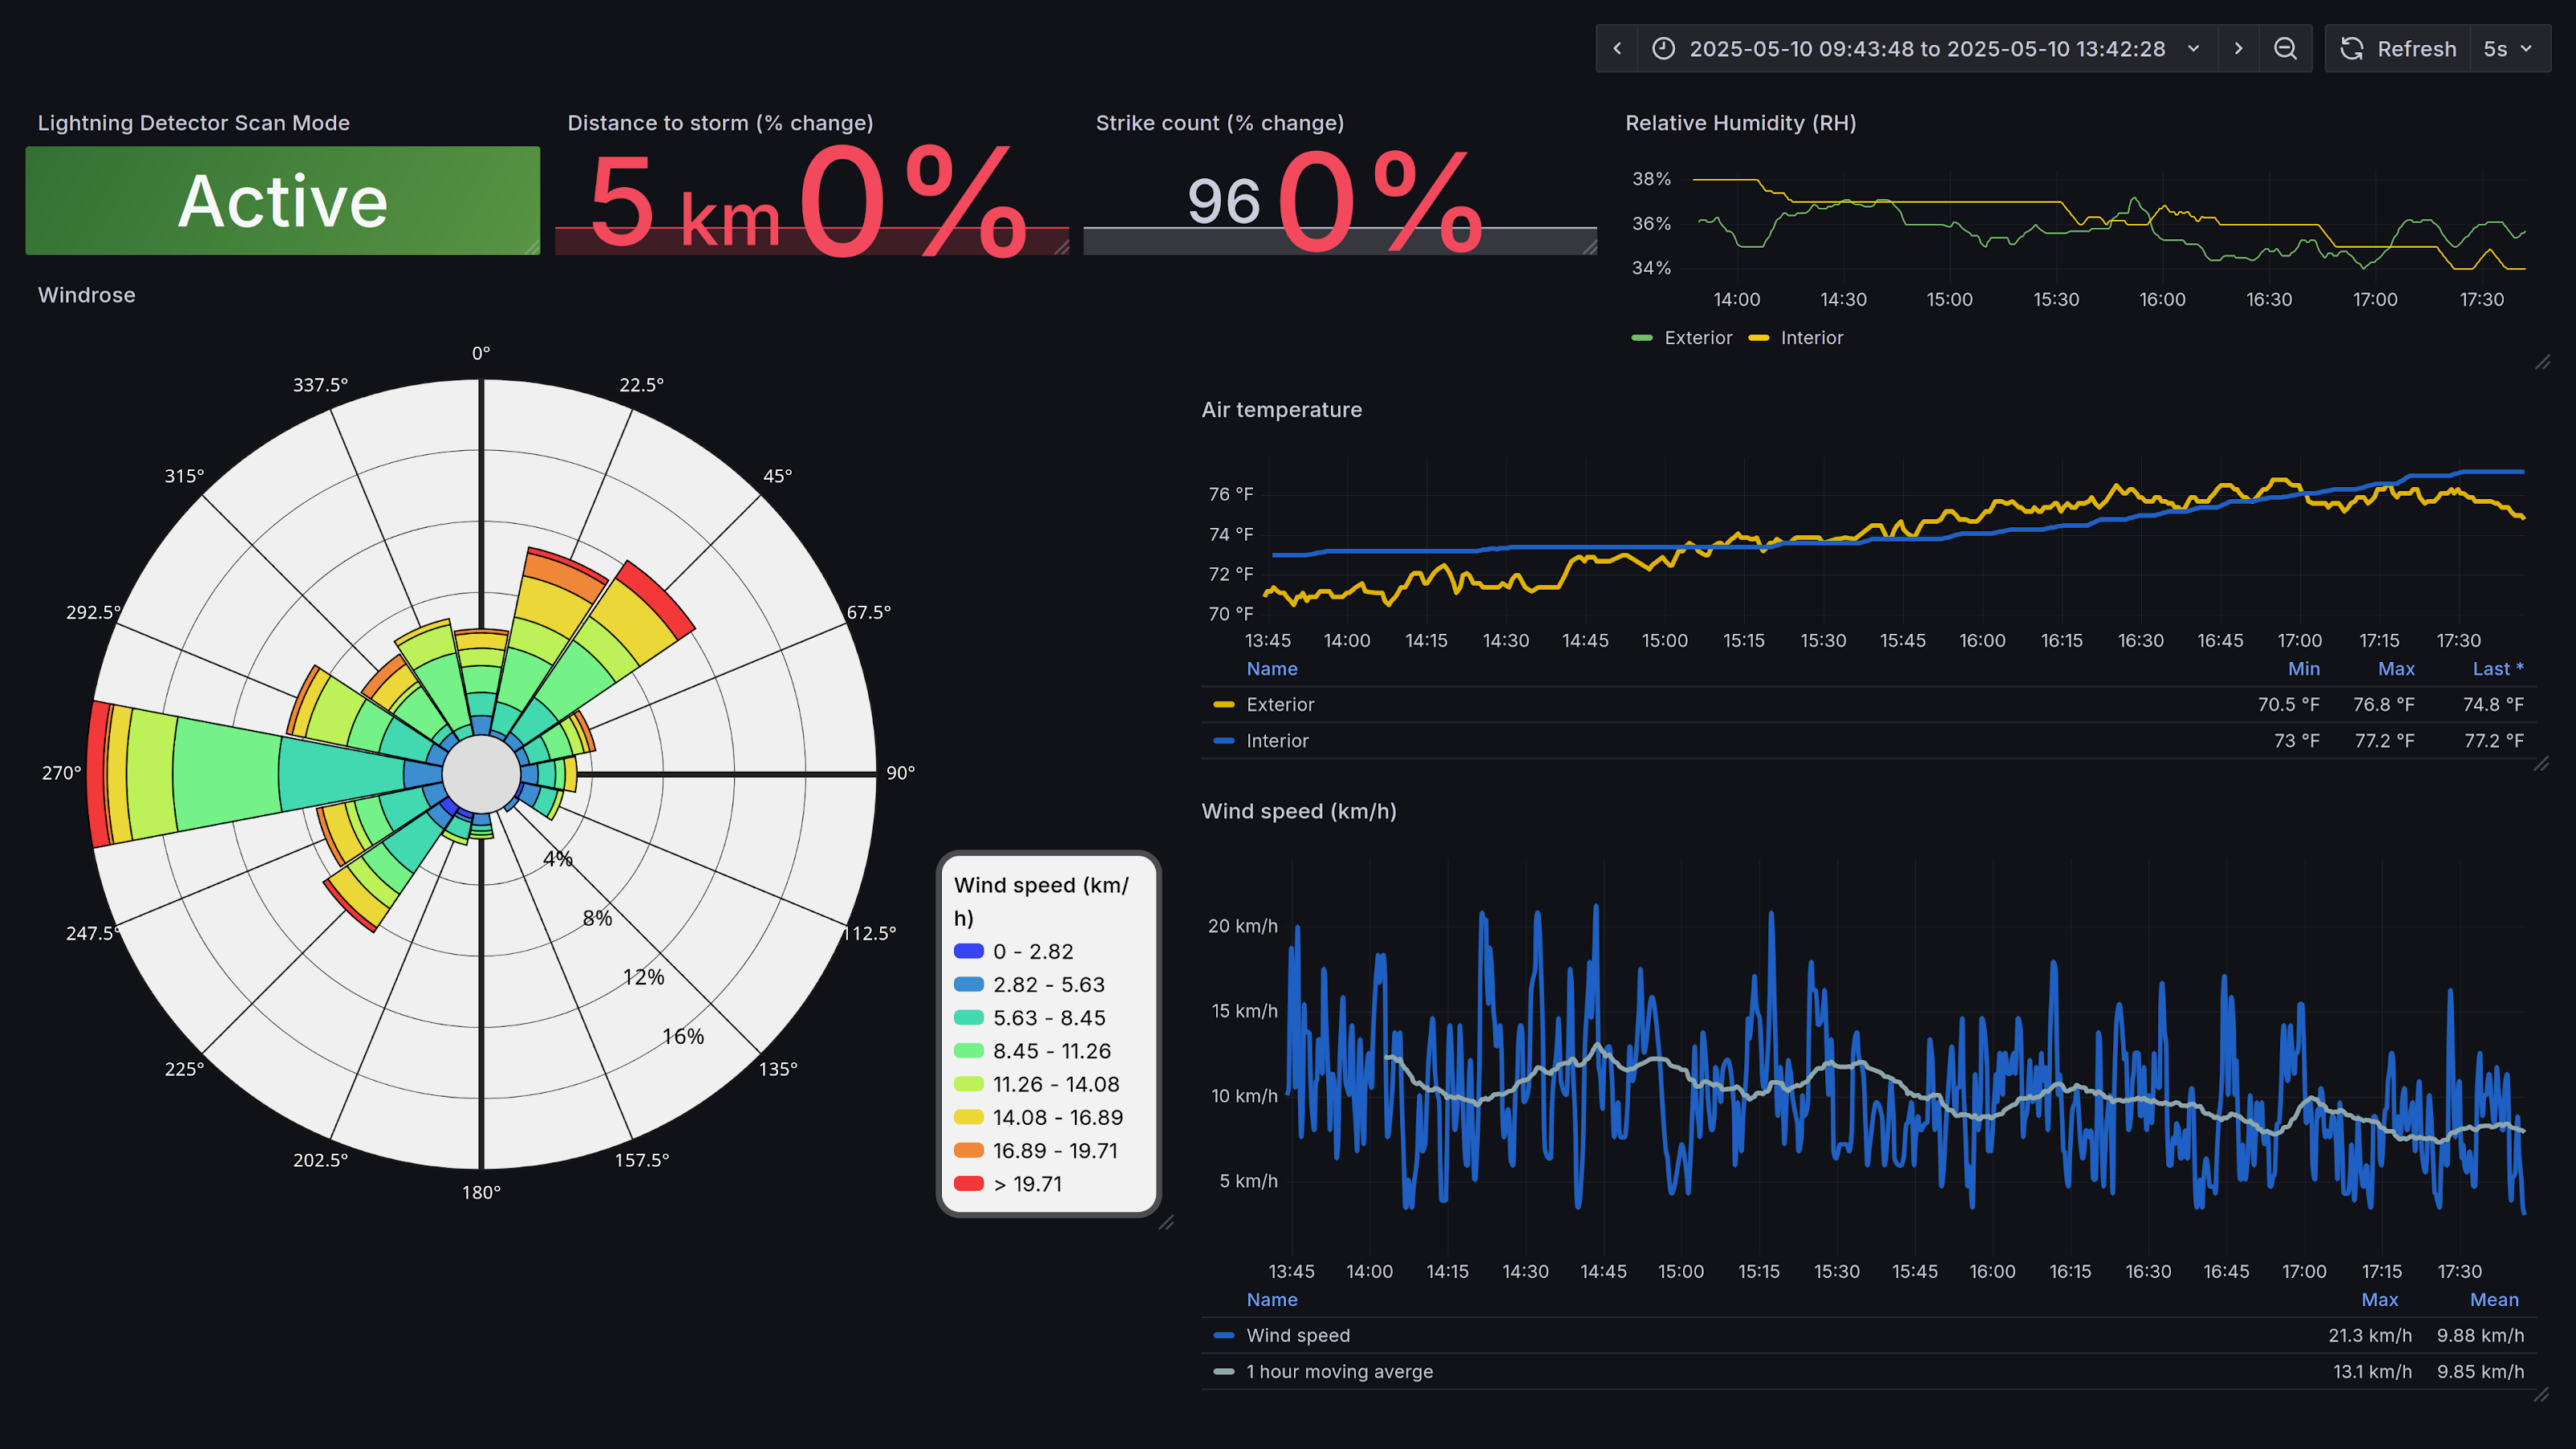
DC Sail has a small Accurite weather station, highly necessary for waterfront operations, but limited visibility of the data and no historical view. This platform collects 433mhz chirps from the base stations, records them in a time series database, and shows the last 6 hours of conditions on the dock.
Repository on GitHub tlmcnulty/sail-wx
In Action
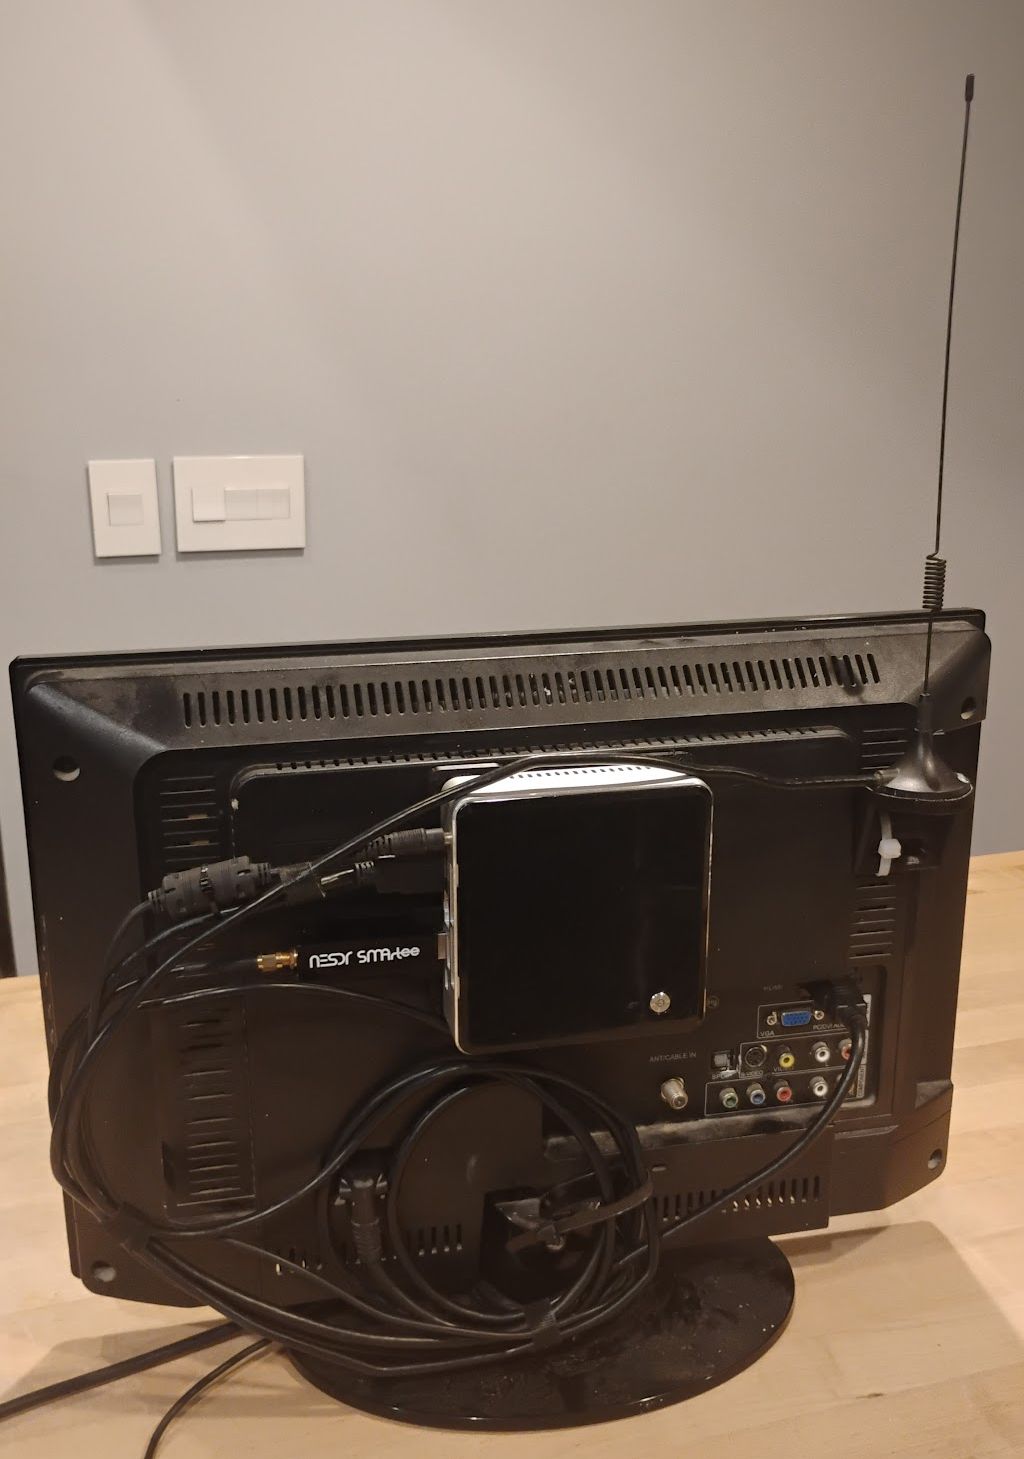
This package is nice but the antenna recieves WAY too much radio frequency interference when in its little mount. On site the antenna is moved near a window.
This project includes software defined radio, system programming, application programming, CAD, manufacture, and the dashboard. The models are available on printables.
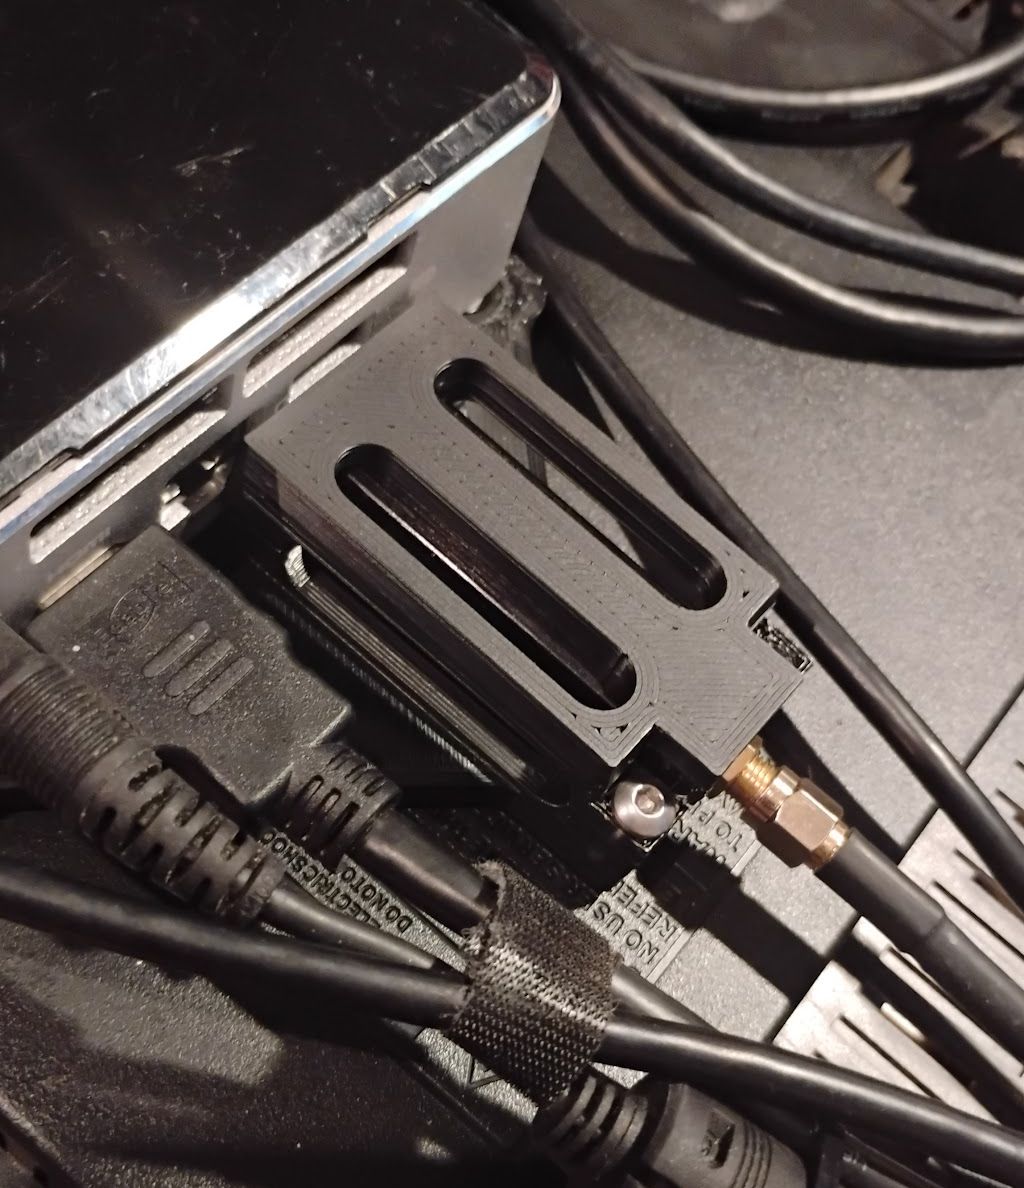
The dongle is securely held against the same mount the Intel NUC6i3SYK is attached to.
Message chirps from the devices look like this:
{"time" : "2025-05-03 08:45:24", "model" : "Acurite-5n1", "message_type" : 56, "id" : 4083, "channel" : "B", "sequence_num" : 2, "battery_ok" : 1, "wind_avg_km_h" : 15.900, "temperature_F" : 72.000, "humidity" : 84, "mic" : "CHECKSUM"}
{"time" : "2025-05-03 08:45:27", "model" : "Acurite-6045M", "id" : 21, "channel" : "B", "battery_ok" : 1, "temperature_F" : 71.400, "humidity" : 46, "strike_count" : 13, "storm_dist" : 17, "active" : 0, "rfi" : 0, "exception" : 0, "raw_msg" : "80156f2e111206d12c"}
I've often used the timestamp within a measurement directly for its storage in the time series, but unless time difference and accuracy constraints require that the insertion operation may work better if the current system time is used. For something like this the amount of time between measurement and insertion is acceptable, but this may not be the case in all scenarios.
In noisier environments it's necessary to filter based on model, but we have no other 433mhz devices on the dock.
The system doesn't need custom boot logos, but I gave it them anyway. rtl_433 shouldn't be run with elevated permissions, so a user level systemd unit is defined and wanted by default.target.
The windrose plugin is a freely available Grafana plugin. Big ups Operato. https://grafana.com/grafana/plugins/operato-windrose-panel
Conclusion and Feedback
Feedback has been positive. Obviously this was at least in part driven by my own need/interest as a user but I certainly don't spend as much time on the dock as others might. There are camps that run full-time in season. It's also a less daunting prospect for someone with my background; a lot of the connective tissue here was simply pulled from other projects. The thing that took the most time was user experience/polish and planning for deployment in an airgapped environment for use by personnel with no training or troubleshooting capacity. Turning it on and off again is about the only thing you can expect from someone.
Knowledge of the weather, current conditions, and basic forecasting are vital to safe operations around the water. Sailors know this, and as I'd hoped I've been told this display has been helpful for both youth camps and school racing teams. The windrose is an at-a-glance reference for mark setting. All in, pretty good tool.